

1. Introduction: Grafana and Zabbix responsibilities
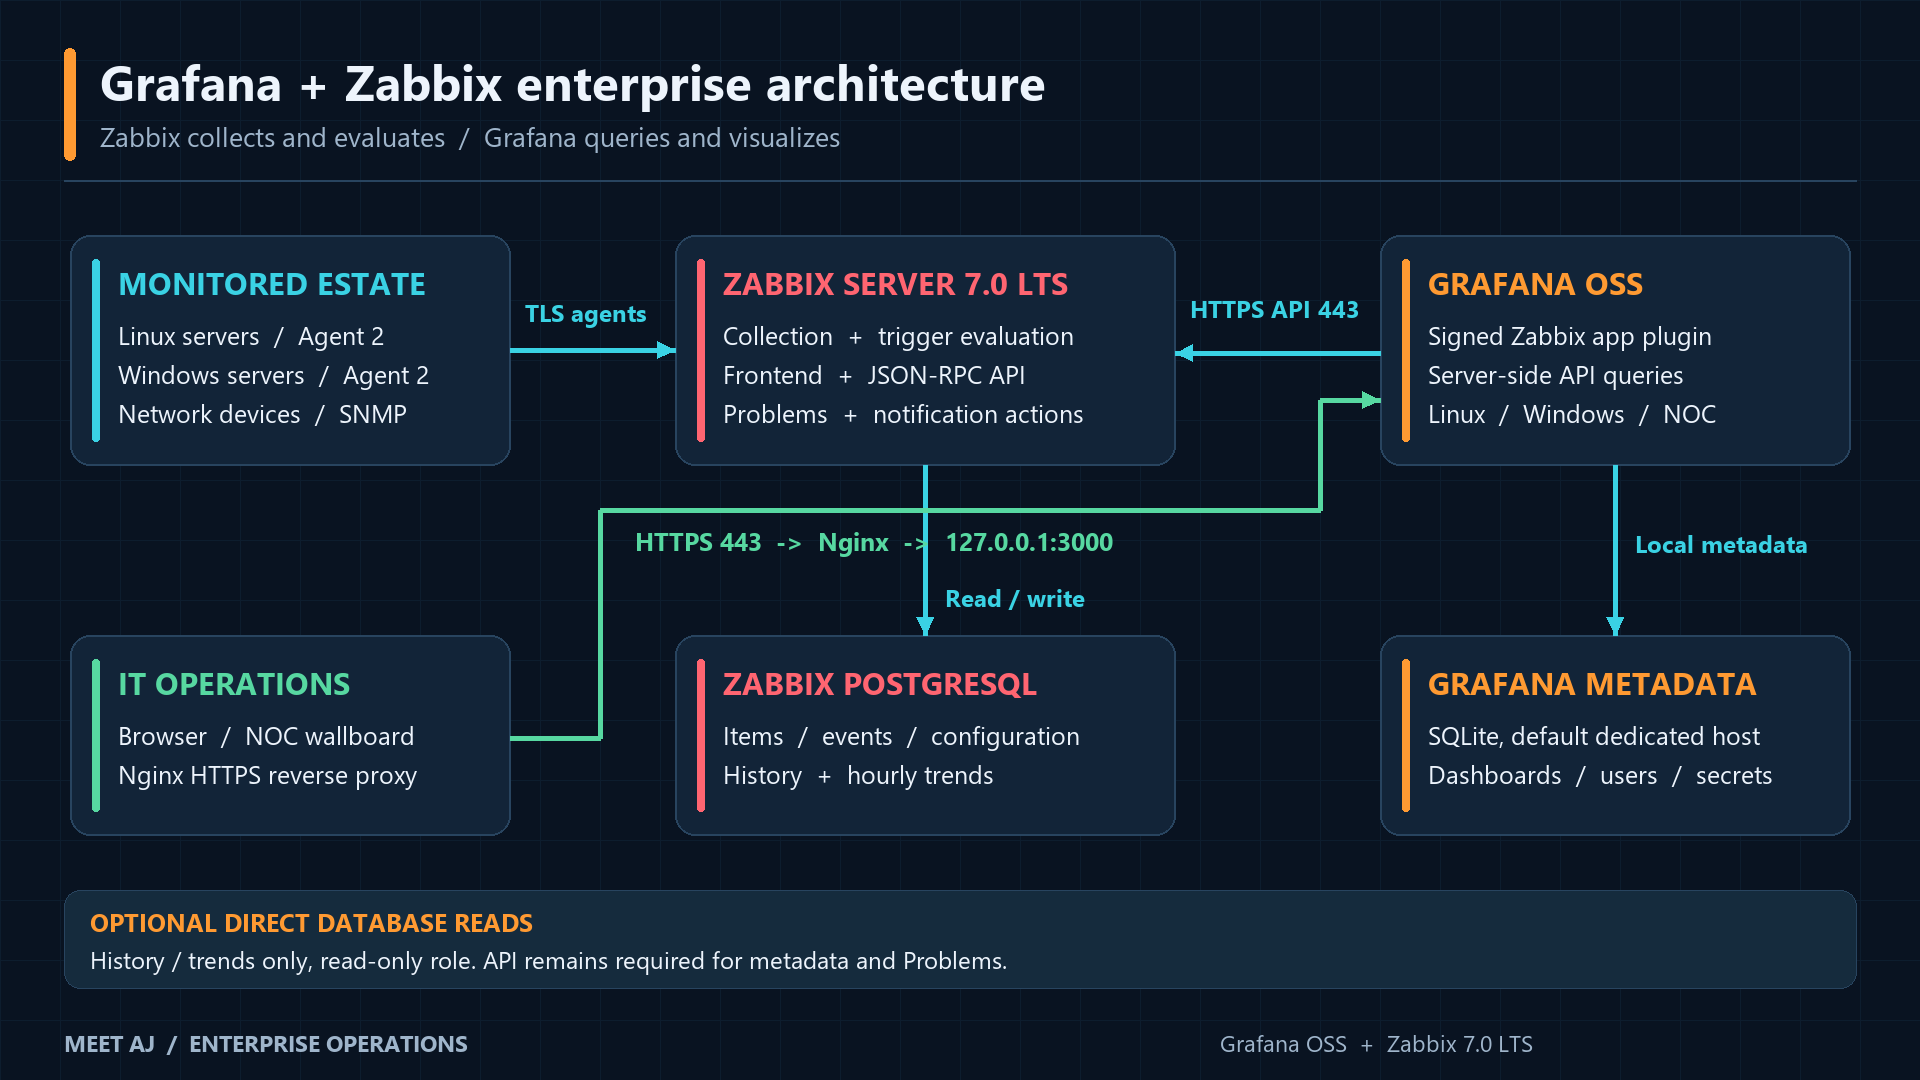
Grafana is a visualization and observability application. Its backend handles authentication, data-source requests, dashboard storage and scheduled alert evaluation; its browser frontend renders panels. Grafana queries data sources rather than replacing the monitoring collectors. In this architecture Zabbix agents collect operating-system metrics, Zabbix Server stores history and trends in PostgreSQL and evaluates triggers, and Grafana visualizes that data through the signed Zabbix app plugin and HTTPS API.
| Concept | Operational meaning |
|---|---|
| Data source | A configured connection such as Zabbix, Prometheus, PostgreSQL or Loki. Credentials remain on the server. |
| Dashboard / panel | A dashboard organizes panels. A panel combines queries, transformations, units and a visualization. |
| Variables | Reusable selectors for host groups, hosts, item tags and interfaces. Variables are filters, not authorization boundaries. |
| Zabbix triggers / problems | Zabbix evaluates item expressions, records incidents and handles actions/escalations. |
| Grafana Alerting | Independent server-side rules with contact points and notification policies; selected plugin queries support alerting. |
Grafana OSS includes core dashboards, basic organization roles, folder permissions and alerting. Licensed Enterprise adds granular RBAC, data-source permissions and other enterprise features. An enterprise monitoring architecture does not require the Enterprise edition. OSS Viewers can query organization data sources; restricting a dashboard does not restrict the underlying data. Use separate organizations/data sources with appropriately scoped Zabbix users when data isolation is required.
Organizations integrate them for a shared NOC screen, application and infrastructure comparisons, capacity trends, incident correlation and executive service views. Zabbix remains the collection and incident system of record. Keep failure-domain boundaries visible: Grafana SQLite is its metadata store, while PostgreSQL in the architecture is the existing Zabbix database. Grafana can later use its own PostgreSQL database for availability requirements.
2. Prerequisites and supported versions
Use a dedicated Ubuntu Server 24.04 LTS host. Start a modest production deployment at 2 vCPU, 4 GB RAM and 20–40 GB disk, with a separate mounted backup volume; these are planning recommendations, not measured capacity guarantees. Size for concurrent users, panels, refresh rates, alert evaluations and any local logs. Grafana does not copy all Zabbix history into its own database.
| Component | Baseline |
|---|---|
| Ubuntu | 24.04 LTS, current security updates; systemd, Nginx, trusted TLS. |
| Grafana OSS | 13.2.3 stable from the official download selector (released 29 September 2026); install the stable APT candidate. |
| Zabbix app | 6.9.1 stable, catalog updated 6 October 2026, Grafana >=11.6.0. ID: alexanderzobnin-zabbix-app. |
| Zabbix | Existing 7.0 LTS Server/Frontend/API with authorized read access; OS templates from 7.0. |
Versions were The plugin minimum is satisfied by 13.2.3 and its documentation explicitly supports Zabbix 7.0 token handling. This is documented compatibility, not a live integration test. Recheck release notes and package candidates before each maintenance window. Never select beta, nightly or release-candidate repositories.
grafana.example.com  192.0.2.20
zabbix.example.com   192.0.2.10
linux-app-01        198.51.100.21
windows-app-01      198.51.100.22
backup.example.com  203.0.113.30
All IPs above are RFC 5737 documentation addresses and must be replaced. Configure A/AAAA records only for addresses actually routed to the service. Use a real owned domain for a public certificate; example.com cannot be issued to you. Validate DNS, the Zabbix frontend path, outbound API access, trusted CA chain and time synchronization before installing.
hostnamectl
sudo hostnamectl set-hostname grafana.example.com
getent ahosts grafana.example.com zabbix.example.com
timedatectl status
sudo timedatectl set-ntp true
timedatectl timesync-status
curl --fail --silent --show-error --connect-timeout 5 https://zabbix.example.com/ -o /dev/null| Direction / port | Purpose and policy |
|---|---|
| Operators -> Grafana TCP 443 | HTTPS from management VPN or approved networks. |
| ACME -> Nginx TCP 80 | Required for HTTP-01 validation and renewal; use DNS-01 if inbound HTTP is prohibited. |
| Grafana -> Zabbix TCP 443 | HTTPS API only. Port 10051 is not the Grafana data source API. |
| Nginx -> Grafana TCP 3000 | Loopback only; no public firewall allowance. |
| Administration TCP 22 | SSH from management network; preserve a working session before UFW changes. |
| Optional TCP 5432 / 10051 | 5432 only for optional Direct DB; 10051 only for the supplied NOC collector sender, restricted source and TLS PSK. |
3. Install Grafana on Ubuntu and verify systemd
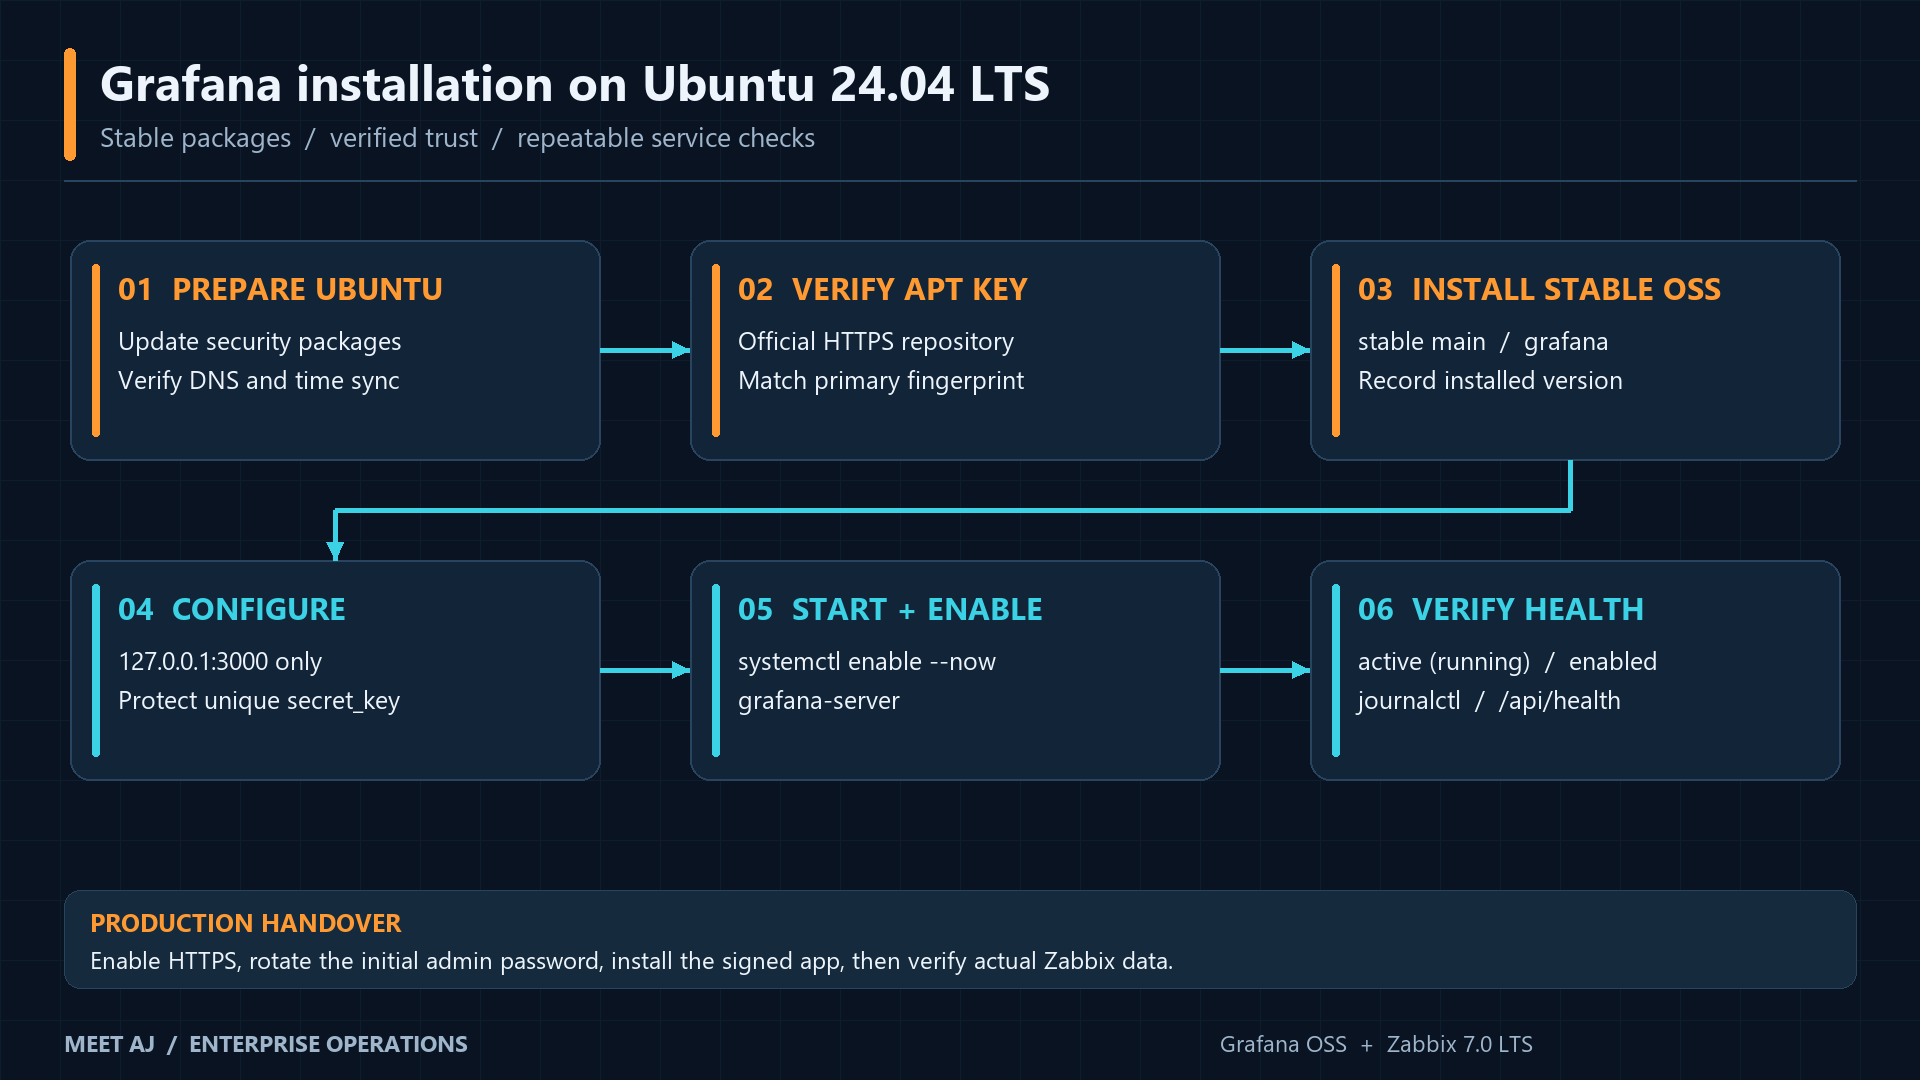
Run the following on the dedicated Grafana host during an approved maintenance window. Inspect pending Ubuntu upgrades and reboot requirements before starting dependent services. Repository signing uses a scoped keyring rather than the deprecated apt-key command. Verify the current primary fingerprint against the official repository page before trusting the key.
sudo apt-get update
sudo apt-get upgrade -y
sudo apt-get install -y ca-certificates curl gnupg apt-transport-https nginx ufw sqlite3 python3
sudo install -d -m 0755 /etc/apt/keyrings
keyfile=$(mktemp)
curl --fail --silent --show-error https://apt.grafana.com/gpg.key -o "$keyfile"
gpg --show-keys --with-fingerprint "$keyfile"
fingerprint=$(gpg --show-keys --with-colons "$keyfile" | awk -F: '$1=="fpr" {print $10; exit}')
test "$fingerprint" = B53AE77BADB630A683046005963FA27710458545 || { echo 'STOP: verify key rotation with Grafana' >&2; exit 1; }
sudo install -m 0644 "$keyfile" /etc/apt/keyrings/grafana.asc
rm -- "$keyfile"
printf '%s\n' 'deb [signed-by=/etc/apt/keyrings/grafana.asc] https://apt.grafana.com stable main' | sudo tee /etc/apt/sources.list.d/grafana.list
sudo apt-get update
apt-cache policy grafana
candidate=$(apt-cache policy grafana | awk '/Candidate:/ {print $2}')
case "$candidate" in *beta*|*rc*|*nightly*|*alpha*|\(none\)) echo 'STOP: stable candidate required' >&2; exit 1;; esac
sudo apt-get install -y grafana
dpkg-query -W -f='${Package} ${Version}\n' grafana
grafana --version
APT verifies repository metadata and package hashes using the scoped signing key. The review-time fingerprint is B53AE77BADB630A683046005963FA27710458545; on a future rotation stop and verify the replacement independently. The stable candidate can advance beyond 13.2.3; record the actual installed version and recheck plugin release notes rather than forcing an obsolete package.
Configure the instance before operator access
Download the package into an operator workspace and run subsequent file-copy commands there. Back up the packaged default grafana.ini before replacing it on this new host. Create one unique secret key, protect it and keep it through recovery: changing it later can prevent Grafana from decrypting stored data-source credentials. Do not overwrite an established instance secret.
sudo cp -a /etc/grafana/grafana.ini /etc/grafana/grafana.ini.before-enterprise
sudo install -d -o root -g grafana -m 0750 /etc/grafana/secrets
sudo bash -c 'umask 027; test ! -e /etc/grafana/secrets/secret_key && openssl rand -hex 32 > /etc/grafana/secrets/secret_key'
sudo chown root:grafana /etc/grafana/secrets/secret_key
sudo chmod 0640 /etc/grafana/secrets/secret_key
sudo install -o root -g grafana -m 0640 grafana.ini /etc/grafana/grafana.ini
sudo systemctl enable --now grafana-server
sudo systemctl status grafana-server --no-pager
sudo systemctl is-enabled grafana-server
sudo journalctl -u grafana-server -n 100 --no-pager
sudo ss -lntp | grep ':3000'
curl --fail --silent --show-error --header "Host: grafana.example.com" http://127.0.0.1:3000/api/health[paths]
data = /var/lib/grafana
logs = /var/log/grafana
plugins = /var/lib/grafana/plugins
provisioning = /etc/grafana/provisioning
[server]
protocol = http
http_addr = 127.0.0.1
http_port = 3000
domain = grafana.example.com
enforce_domain = true
root_url = https://grafana.example.com/
[database]
type = sqlite3
path = grafana.db
[security]
secret_key = $__file{/etc/grafana/secrets/secret_key}
cookie_secure = true
cookie_samesite = lax
disable_gravatar = true
[users]
allow_sign_up = false
auto_assign_org_role = Viewer
[auth.anonymous]
enabled = false
[log]
mode = console file
level = info
[dashboards]
min_refresh_interval = 30senable --now both starts the service and schedules startup at boot. status should report active (running), is-enabled should return enabled, and the health response should contain database: ok and the installed version. ss must show 127.0.0.1:3000, not 0.0.0.0:3000. journalctl shows startup, migration and plugin errors; never publish logs containing credentials. root_url points to the external HTTPS name while protocol stays http because Nginx terminates TLS.
For the first administrator login before HTTPS, use a temporary SSH tunnel: ssh -L 3000:127.0.0.1:3000 operator@grafana.example.com. If enforce_domain and secure cookies block HTTP login, complete the HTTPS chapter first; keep the production configuration intact. Open https://grafana.example.com/login after TLS is ready, log in with the new-instance admin/admin defaults and immediately set a unique vault-managed password. Create named administrator accounts and a controlled emergency account; never share the bootstrap password.
4. Production security, Nginx and HTTPS
Public port 3000 would bypass Nginx TLS, access controls and logging. Bind Grafana to loopback, permit inbound 443 only from approved management networks and preserve restricted SSH access. Treat IPv6 separately. Port 80 below supports ACME HTTP-01; a VPN-only site should instead obtain a valid organizational CA certificate or use DNS-01 with an approved DNS provider.
sudo ufw allow from 192.0.2.0/24 to any port 22 proto tcp
sudo ufw allow from 192.0.2.0/24 to any port 443 proto tcp
sudo ufw allow 80/tcp
sudo ufw default deny incoming
sudo ufw default allow outgoing
sudo ufw enable
sudo ufw status verbose
Bootstrap a valid certificate before enabling the TLS virtual host
Replace the domain and certificate paths in both downloaded Nginx files. Install only the bootstrap HTTP site first, because nginx -t cannot load a certificate that does not exist. Confirm no other enabled site uses the same server_name. The following Certbot webroot flow requires public DNS and public TCP 80 reachability; it is not suitable for the RFC 5737 addresses as written.
server {
    listen 80;
    listen [::]:80;
    server_name grafana.example.com;
    location ^~ /.well-known/acme-challenge/ { root /var/www/acme; }
    location / { return 404; }
}sudo apt-get install -y certbot
sudo install -d -m 0755 /var/www/acme
sudo install -m 0644 nginx-bootstrap.conf /etc/nginx/sites-available/grafana
sudo ln -s /etc/nginx/sites-available/grafana /etc/nginx/sites-enabled/grafana
sudo nginx -t
sudo systemctl reload nginx
sudo certbot certonly --webroot -w /var/www/acme -d grafana.example.com
sudo install -m 0644 nginx-grafana.conf /etc/nginx/sites-available/grafana
sudo nginx -t
sudo systemctl reload nginx
curl --fail --silent --show-error https://grafana.example.com/api/health# Include inside nginx's http context (Ubuntu sites-enabled is in http).
map $http_upgrade $grafana_connection_upgrade {
default upgrade;
'' close;
}
upstream grafana_backend {
server 127.0.0.1:3000;
keepalive 16;
}
server {
listen 80;
listen [::]:80;
server_name grafana.example.com;
location ^~ /.well-known/acme-challenge/ {
root /var/www/acme;
}
location / { return 301 https://grafana.example.com$request_uri; }
}
server {
listen 443 ssl;
listen [::]:443 ssl;
server_name grafana.example.com;
ssl_certificate /etc/letsencrypt/live/grafana.example.com/fullchain.pem;
ssl_certificate_key /etc/letsencrypt/live/grafana.example.com/privkey.pem;
ssl_protocols TLSv1.2 TLSv1.3;
ssl_session_cache shared:GrafanaTLS:10m;
ssl_session_timeout 1d;
add_header Strict-Transport-Security "max-age=31536000" always;
add_header X-Content-Type-Options nosniff always;
# Optional management/VPN allowlist, ONLY after ACME/bootstrap works:
# allow 192.0.2.0/24;
# deny all;
location / {
proxy_pass http://grafana_backend;
proxy_http_version 1.1;
proxy_set_header Host $host;
proxy_set_header X-Real-IP $remote_addr;
proxy_set_header X-Forwarded-For $remote_addr;
proxy_set_header X-Forwarded-Proto https;
proxy_set_header Connection "";
proxy_read_timeout 60s;
}
location /api/live/ {
proxy_pass http://grafana_backend;
proxy_http_version 1.1;
proxy_set_header Host $host;
proxy_set_header X-Real-IP $remote_addr;
proxy_set_header X-Forwarded-For $remote_addr;
proxy_set_header X-Forwarded-Proto https;
proxy_set_header Upgrade $http_upgrade;
proxy_set_header Connection $grafana_connection_upgrade;
proxy_read_timeout 3600s;
}
}The map and upstream belong in the http context; Ubuntu sites-enabled is included there. Forwarded headers are overwritten at the trusted proxy. The /api/live/ location carries the WebSocket Upgrade headers. nginx -t should report syntax is ok and test is successful before reload; this only validates configuration, not certificates issued by a real CA or upstream application health. Keep HSTS only after HTTPS works and plan its cached effect during rollback.
sudo install -d -m 0755 /etc/letsencrypt/renewal-hooks/deploy
printf '%s\n' '#!/bin/sh' 'nginx -t && systemctl reload nginx' | sudo tee /etc/letsencrypt/renewal-hooks/deploy/reload-nginx >/dev/null
sudo chmod 0755 /etc/letsencrypt/renewal-hooks/deploy/reload-nginx
sudo systemctl enable --now certbot.timer
sudo certbot renew --dry-run
sudo systemctl list-timers certbot.timer
openssl s_client -connect grafana.example.com:443 -servername grafana.example.com -verify_return_error </dev/null- Use cookie_secure=true and SameSite=lax with HTTPS; verify Secure and HttpOnly session attributes in browser developer tools. Disable anonymous access and self-signup.
- Assign Viewers to NOC operators, Editors to dashboard authors and organization Admin only to data-source administrators. Server administrator is a separate privileged responsibility.
- Prefer approved OIDC/OAuth or LDAP integration; enforce MFA at the identity provider, test role mapping and account removal. Maintain a audited break-glass account.
- Install signed plugins from the official catalog, record versions, stage updates, and keep unsigned-plugin exceptions disabled. Do not grant integration users write/acknowledge permissions merely to make a panel work.
- Monitor certificate expiry, renewal failures, failed logins and service health from outside Grafana. Restrict access to configuration, encryption keys and backups.
Official reverse-proxy and Grafana Live configuration
5. Install and enable the official Zabbix plugin
sudo grafana cli --pluginsDir /var/lib/grafana/plugins plugins install alexanderzobnin-zabbix-app
sudo systemctl restart grafana-server
sudo grafana cli --pluginsDir /var/lib/grafana/plugins plugins ls
sudo journalctl -u grafana-server -n 100 --no-pager
sudo python3 -c 'import json; p=json.load(open("/var/lib/grafana/plugins/alexanderzobnin-zabbix-app/plugin.json")); print(p["id"],p["info"]["version"],p["dependencies"]["grafanaDependency"])'
The current CLI is grafana cli; the standalone grafana-cli is deprecated and fails on Grafana 13.x. Explicit pluginsDir matches the Debian package paths. At review time the official stable catalog supplies 6.9.1. Confirm the app ID and dependency from plugin.json and a successful signed-plugin startup in the journal. File installation alone does not enable an app plugin.
In the current UI open Administration > Plugins and data > Plugins, search Zabbix, open its page and click Enable. Then Connections > Add new connection > Zabbix > Add new data source becomes available. For repeatable provisioning install zabbix-app.yaml under /etc/grafana/provisioning/plugins/ and restart. Do not edit packaged defaults or enable obsolete Angular support.
apiVersion: 1
apps:
  - type: alexanderzobnin-zabbix-app
    org_id: 1
disabled: falsesudo install -d -o root -g grafana -m 0750 /etc/grafana/provisioning/plugins
sudo install -o root -g grafana -m 0640 zabbix-app.yaml /etc/grafana/provisioning/plugins/zabbix-app.yaml
sudo systemctl restart grafana-server
# Upgrade during a tested maintenance window, after backing up:
sudo grafana cli --pluginsDir /var/lib/grafana/plugins plugins update alexanderzobnin-zabbix-app
sudo systemctl restart grafana-serverStage each update with the same Grafana version, Zabbix API version, dashboards and alert rules. If dependencies are incompatible, restore the previously approved plugin artifact and the matching Grafana/database snapshot. Use the documented CLI version argument to pin an approved plugin, for example plugins install alexanderzobnin-zabbix-app 6.9.1 on a fresh staging installation. Never solve signature or version failures by allowing arbitrary unsigned code.
6. Connect Grafana to the Zabbix HTTPS API
Prepare Zabbix authorization and verify the endpoint
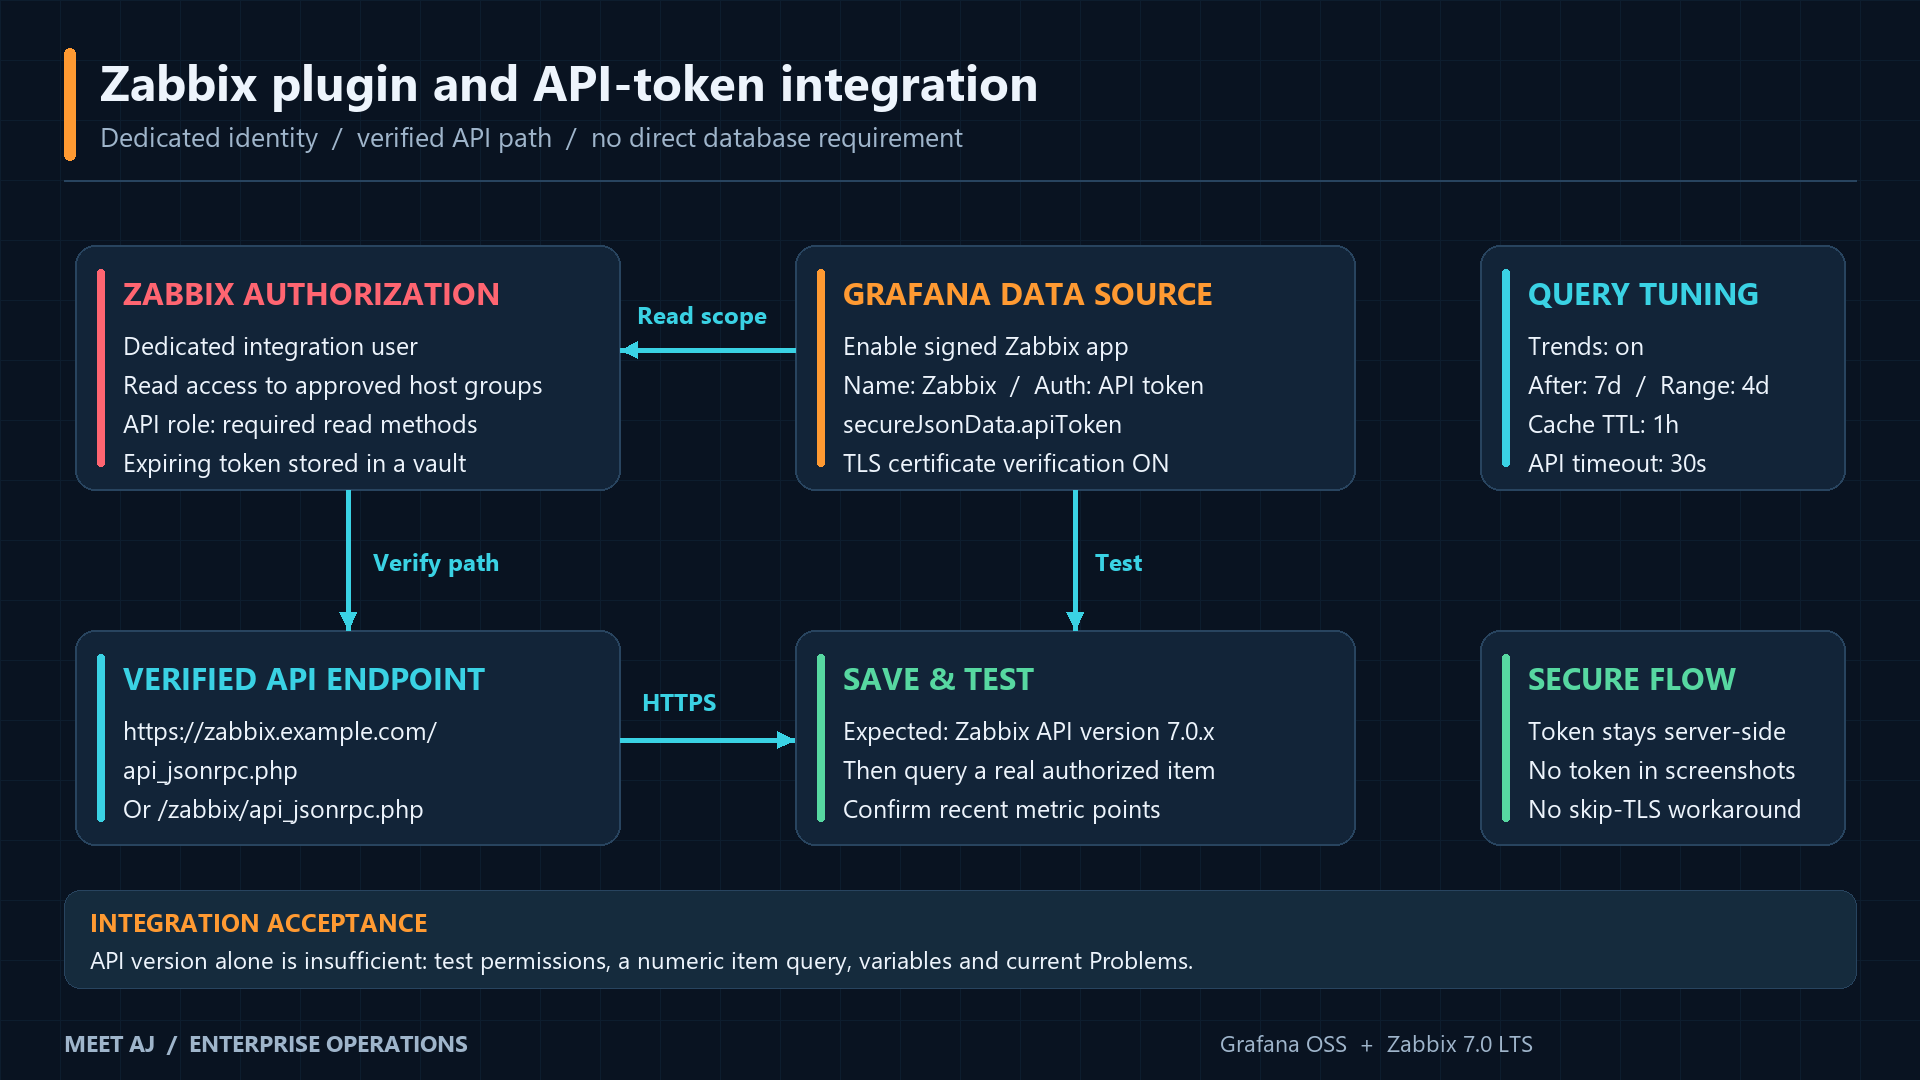
On the Zabbix host verify systemctl status zabbix-server and the frontend HTTPS response. In Zabbix 7.0 go to Users > User groups and create Grafana readers. Grant Read access under Host permissions only to the approved Linux, Windows and NOC collector groups. Under Users > User roles create a User-type API role with read methods needed by the plugin (hostgroup.get, host.get, hostinterface.get, item.get, history.get, trend.get, trigger.get, problem.get, event.get and supporting read methods such as user.get/valuemap.get when used). Permit API access, deny write methods, and inspect missing-method errors instead of selecting Super admin.
Create a named integration user under Users > Users, attach that group and role, and keep its interactive password in a vault. An administrator can create an expiring token for that owner under Users > API tokens; a user manages its own tokens under User settings > API tokens when allowed by its role. Generate once, store securely and rotate with overlap. Tokens inherit the owner’s host and role permissions; they do not grant access on their own.
ZABBIX_API_URL=https://zabbix.example.com/api_jsonrpc.php
curl --fail --silent --show-error --connect-timeout 5 --max-time 30 \
  -H 'Content-Type: application/json-rpc' \
  --data '{"jsonrpc":"2.0","method":"apiinfo.version","params":{},"id":1}' \
  "$ZABBIX_API_URL"
A JSON-RPC result containing 7.0.x confirms the frontend API path; HTML, a login redirect or 404 does not. If the frontend is mounted under /zabbix, repeat with https://zabbix.example.com/zabbix/api_jsonrpc.php. apiinfo.version is unauthenticated and does not prove host permissions or token validity. Never assume the URL path. Verify CA trust with the same host that will run Grafana, and never bypass verification using curl -k or Skip TLS verify.
The download includes a safe API probe using a root-readable token file and HTTPS Authorization header, never a literal token in command history or a screenshot. It prints only API version and visible-host count. Review the role allowlist after adding features; API error details can identify a denied method. Keep Authorization headers preserved through the Zabbix reverse proxy/PHP frontend.
sudo test -e /etc/grafana/secrets/zabbix-token || sudo install -o root -g root -m 0600 /dev/null /etc/grafana/secrets/zabbix-token
sudoedit /etc/grafana/secrets/zabbix-token
sudo ZABBIX_API_URL=https://zabbix.example.com/api_jsonrpc.php ZABBIX_TOKEN_FILE=/etc/grafana/secrets/zabbix-token python3 zabbix-api-probe.py
Configure and test the Grafana data source
| Setting | Value / verification |
|---|---|
| Name / URL | Zabbix; full verified HTTPS api_jsonrpc.php endpoint. |
| Auth type / API Token | API token; paste only into the masked secure field. |
| Trends | Enabled; After 7d and Range 4d only when history retention matches. |
| Cache TTL / timeout | 1h metadata cache; 30s API timeout, queryTimeout 60s. |
| Direct DB / acknowledgments | Direct DB off; disable read-only-user acknowledgments on. |
Open Connections > Data sources > Zabbix after adding it. Set the verified URL, Auth type API token, and Additional settings > Trends / Zabbix API. Click Save & test. Expected success is “Zabbix API version” followed by the detected 7.0 version; wording can vary by patch. Then confirm the host picker lists only authorized groups, run a real CPU item query and verify points arrive. An API-version success alone does not establish working item queries.
apiVersion: 1
datasources:
  - name: Zabbix
    uid: zabbix-enterprise
    type: alexanderzobnin-zabbix-datasource
    access: proxy
    url: ${ZABBIX_API_URL}
    isDefault: true
    jsonData:
      authType: token
      trends: true
      trendsFrom: 7d
      trendsRange: 4d
      cacheTTL: 1h
      timeout: 30
      queryTimeout: 60
      dbConnectionEnable: false
      disableReadOnlyUsersAck: true
      disableDataAlignment: false
    secureJsonData:
      apiToken: $ZABBIX_API_TOKEN
    version: 1
editable: falsesudo install -m 0600 -o root -g root grafana.env.example /etc/grafana/grafana-integration.env
sudoedit /etc/grafana/grafana-integration.env
sudo install -d -m 0755 /etc/systemd/system/grafana-server.service.d
sudo install -m 0644 grafana-environment.conf /etc/systemd/system/grafana-server.service.d/integration.conf
sudo install -o root -g grafana -m 0640 zabbix-datasource.yaml /etc/grafana/provisioning/datasources/zabbix.yaml
sudo systemctl daemon-reload
sudo systemctl restart grafana-server
sudo journalctl -u grafana-server -n 100 --no-pagerReplace the example token locally before restarting. systemd reads the protected EnvironmentFile and passes variables to Grafana; provisioning resolves $ZABBIX_API_TOKEN into secureJsonData.apiToken. The single-dollar form preserves literal dollar characters in a token. With editable:false, change the YAML and bump version rather than editing the provisioned source in the UI. A missing or empty environment variable causes authentication failure. Do not display systemctl show Environment or copy the edited file to the public downloads folder.
Official authentication, provisioning and Save & test fields
7. Build the Linux monitoring dashboard
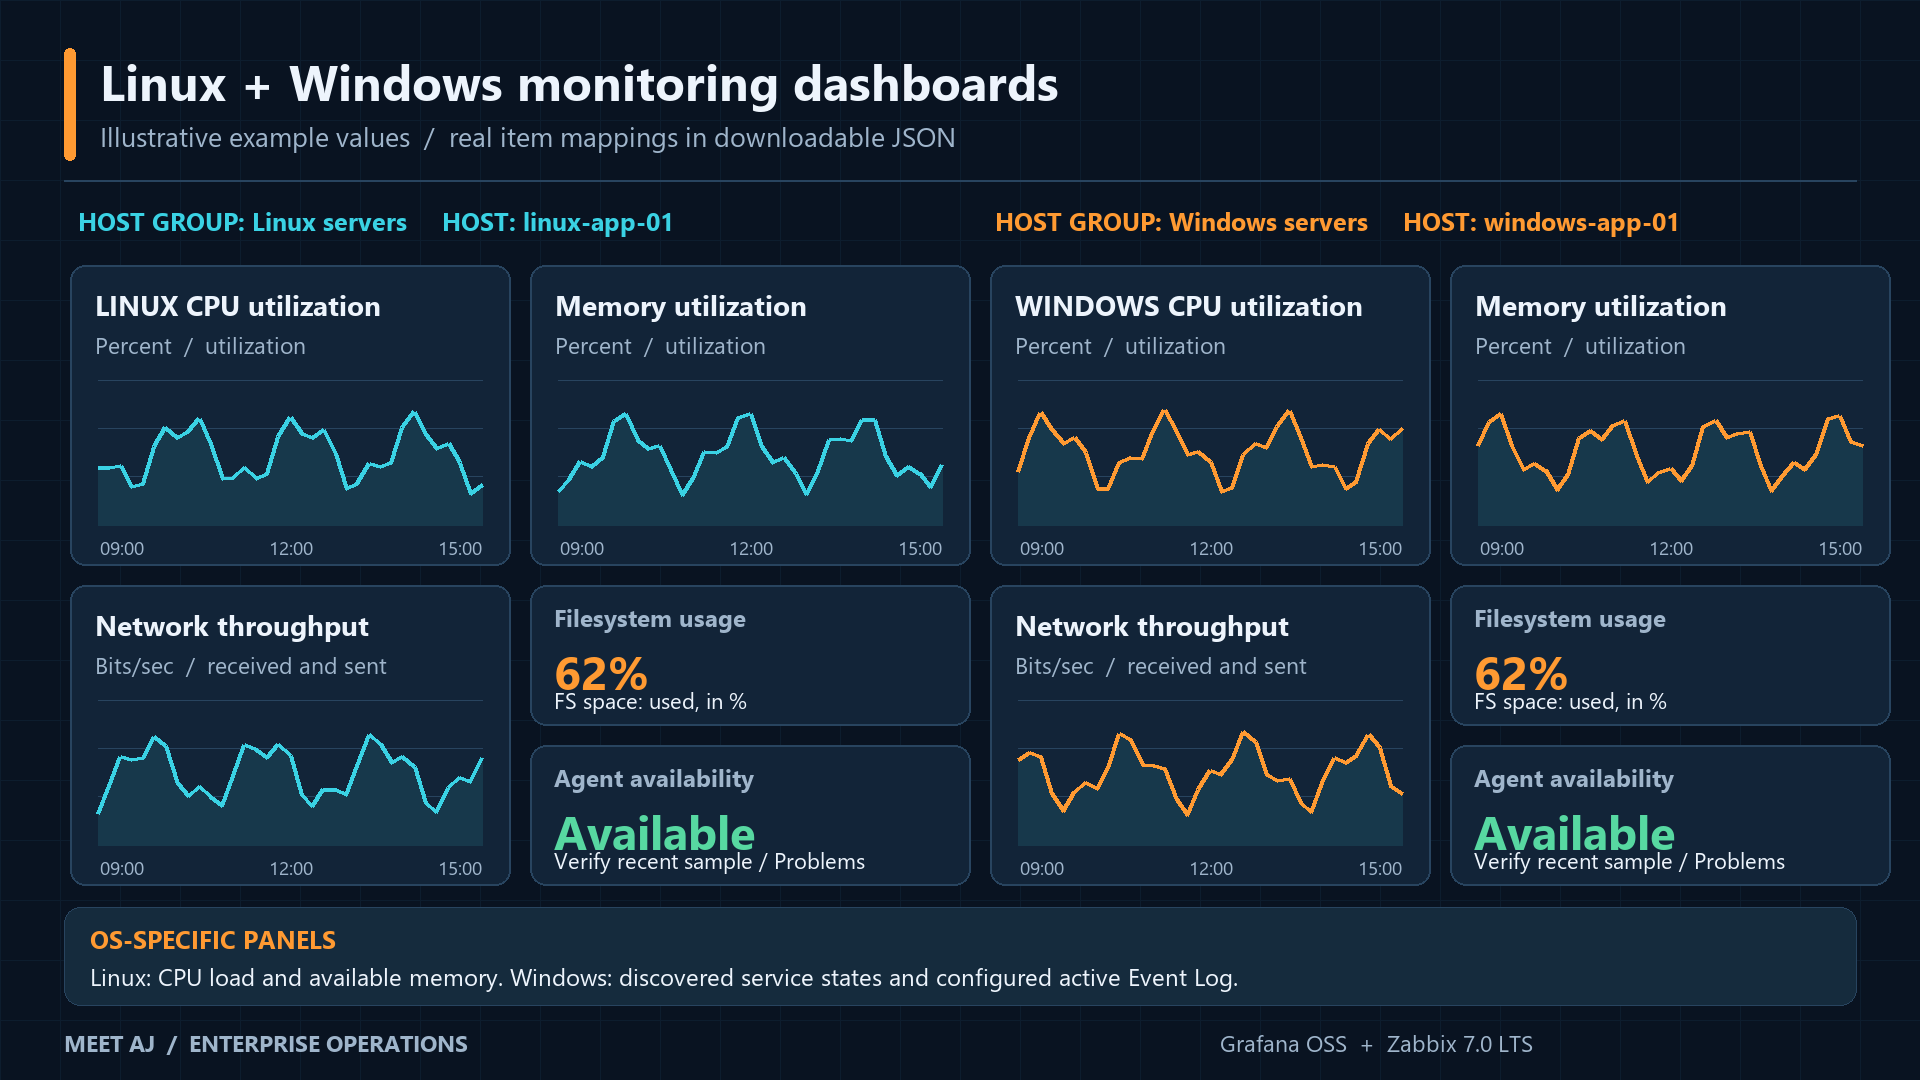
Use the hosts already enrolled in Zabbix. Link the official Linux by Zabbix agent template, or its active variant where appropriate, to an Ubuntu host such as linux-app-01. Check Data collection > Hosts > Items and Monitoring > Latest data for supported items and recent values before opening Grafana. Agent 2 can supply the official agent template metrics. Allow low-level discovery to create real filesystem and interface items; do not query unresolved {#IFNAME} or {#FSNAME} prototypes.
| Panel | Existing item / key | Visualization / units |
|---|---|---|
| CPU utilization | CPU utilization — system.cpu.util | Gauge, percent 0–100 |
| CPU load | Load average (1m avg) — system.cpu.load[all,avg1]; also avg5, avg15 | Time series, unit none; compare to CPU count |
| RAM / available | Memory utilization — vm.memory.utilization; Available memory — vm.memory.size[available] | Gauge percent / time series bytes |
| Filesystem usage / free | FS [/]: Space: Used, in % / Space: Available; vfs.fs.dependent.size[/,pused] / [/,free] | Gauge percent / bytes; select discovered mount |
| Network / interface | Interface ens18: Bits received / Bits sent — net.if.in[ens18] / net.if.out[ens18] after template preprocessing | Time series bits/sec, already rates |
| Uptime / availability | System uptime — system.uptime; Zabbix agent availability — zabbix[host,agent,available] | Stat seconds / 0 unknown, 1 available, 2 unavailable |
| Active problems | Problems query filtered by Group and Host | Zabbix Problems panel, current events |
Names above are examples from the official 7.0 template; discovered interface and mount labels depend on the host. FS used percentage follows the template’s available-space semantics, which may differ from a naïve df calculation on filesystems with reserved blocks. Never graph agent.ping as a down indicator: its last stored value can remain 1 during an outage. Pair availability with Zabbix no-data/availability triggers, problem events and latest timestamp; active-only deployments may need zabbix[host,active_agent,available] rather than the passive availability item.
- Open Dashboards > New > New dashboard > Add visualization. Select Zabbix, Query type Metrics, Group Linux servers, Host linux-app-01, Item CPU utilization. Run the query and compare the last value to Zabbix Latest data.
- Choose Gauge, Unit Percent (0–100), Min 0, Max 100, absolute thresholds green below 80, orange from 80, red from 90. Threshold colors are presentation; they do not create Zabbix triggers or alert rules.
- Add CPU load and available-memory Time series panels, disk Gauge panels, network Time series and uptime/availability Stat panels using the table. Set bytes for memory, bits/sec for network and seconds for uptime.
- Add the plugin’s Zabbix Problems visualization with Query type Problems, Show Problems, Group $group, Host $host, all severities and Use time range off for current incidents. Keep the integration read-only.
- Save into Enterprise monitoring with a 6-hour default range and 1-minute refresh. Import linux-dashboard.json using Dashboards > New > Import, or use the supplied file provider. It references the provisioned zabbix-enterprise UID; change every reference if using a different UID.
Official Zabbix 7.0 Linux template and preprocessing
Provision reviewed dashboard files
sudo install -d -o root -g grafana -m 0750 /var/lib/grafana/dashboards
sudo install -o root -g grafana -m 0640 linux-dashboard.json windows-dashboard.json enterprise-noc-dashboard.json /var/lib/grafana/dashboards/
sudo install -o root -g grafana -m 0640 dashboard-provider.yaml /etc/grafana/provisioning/dashboards/enterprise.yaml
sudo systemctl restart grafana-serverapiVersion: 1
providers:
- name: Enterprise monitoring
orgId: 1
folder: Enterprise monitoring
type: file
disableDeletion: true
updateIntervalSeconds: 60
allowUiUpdates: false
options:
path: /var/lib/grafana/dashboardsUse either UI import or file provisioning for the same dashboard UID; avoid competing owners. The provider creates the Enterprise monitoring folder, polls files every 60s and disables UI saves for file-owned dashboards. Keep the NOC overview unused until its collector is installed. Update source JSON in version control and validate it before replacing provisioned files.
8. Build the Windows Server dashboard
Create a separate Windows dashboard from existing Windows Agent 2 hosts. The official Windows by Zabbix agent template or active variant discovers interfaces, filesystems and services; verify discovery filters and the required agent version in your installed 7.0 template. Review service discovery exclusions so intentional stopped services do not create unnecessary incidents. Grafana selects existing item names; it does not install agents or enable Windows performance counters.
| Panel | Official 7.0 item selector / key |
|---|---|
| CPU / RAM | CPU utilization — system.cpu.util; Memory utilization — vm.memory.util; Used memory — vm.memory.size[used] |
| Disk / free space | FS [label(C:)]: Space: Used, in % / Space: Available; dependent filesystem items from vfs.fs.get |
| Network throughput | Interface name(alias): Bits received / Bits sent; discovered net.if.in / net.if.out keys |
| Windows services | State of service "Spooler" (Print Spooler) — service.info["Spooler",state], when discovered |
| Uptime / availability | Uptime — system.uptime (Linux item name is different); Zabbix agent availability |
| Problems / Event Log | Current Problems query; Text query for a separately configured active Event Log item |
Import windows-dashboard.json, select the Windows servers group and the host, and run each query. Use gauges for CPU/memory/disk, time series for network, and stat/value mappings for service state. service.info state uses 0 for running, 6 for stopped and 255 for no such service; do not reuse availability mappings (1/2) for service states. CPU/Memory thresholds 80/90 are example visualization limits and should be tuned to service baselines.
Add Windows Event Log monitoring explicitly
The default OS template does not collect arbitrary Event Logs. On a Windows host with active Agent 2 connectivity, create a Zabbix agent (active) item named Windows Application errors, Type of information Log, Update interval 30s, History 7d and the supported eventlog key below. The skip mode starts with new events; it does not backfill the entire log. Agent privileges must permit reading the selected channel; Security logs require a separate privilege review.
eventlog[Application,,"Error|Critical",,,,skip]Add tag component:eventlog to that custom item. Generate one approved test Application error in staging and verify it reaches Latest data before testing the Grafana Text query. The downloaded table panel targets that exact custom name and will legitimately show No data until the item exists and receives a new matching log entry. Event content may be sensitive; restrict users and retention. Keep log events and numeric count-based alerting separate.
9. Enterprise NOC dashboard with implemented counts
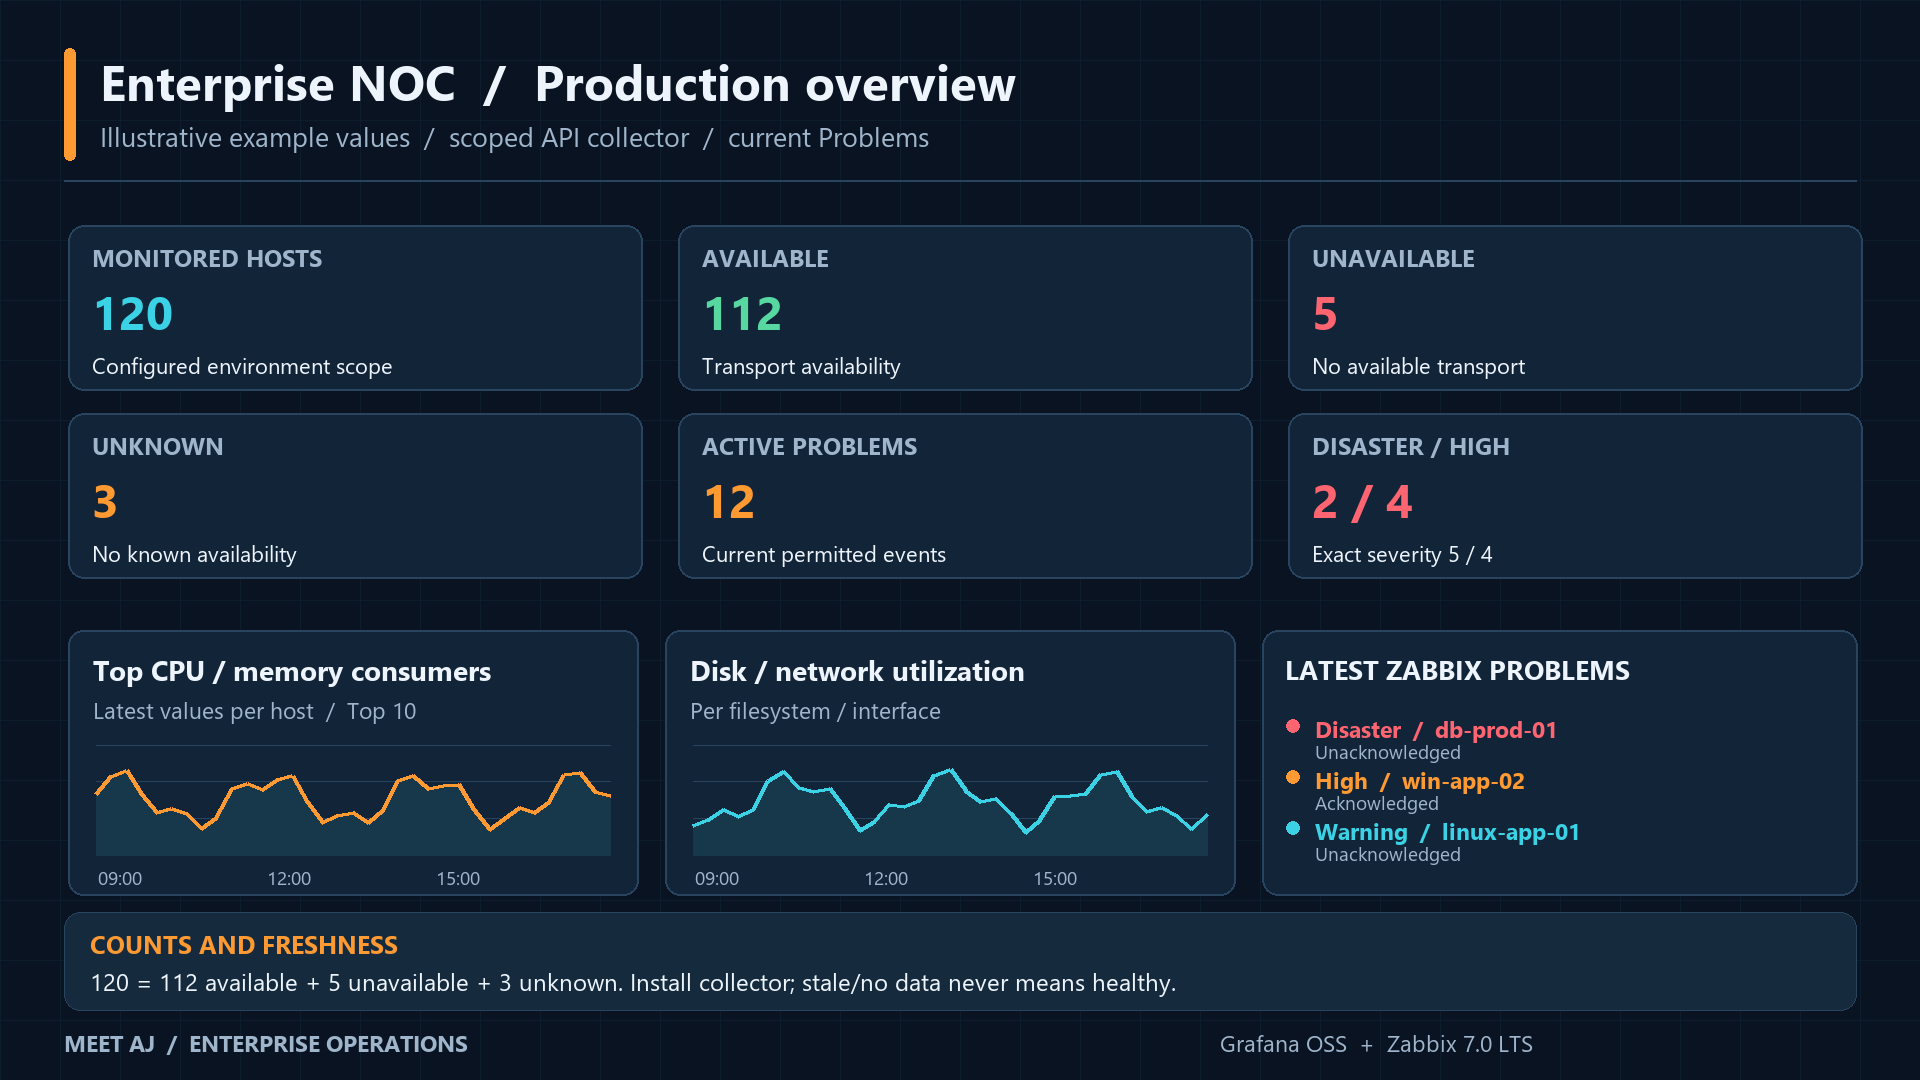
The overview is a real dashboard definition backed by the supplied collector, not hard-coded demo numbers. Native plugin Problems queries produce event tables, and Metrics queries return item series; neither is presented here as an automatic total-host inventory counter. The optional noc-collector.py uses host.get and problem.get, then zabbix_sender with TLS PSK to publish eight explicitly defined trapper metrics. It requires no direct database connection.
| Metric | Implemented definition |
|---|---|
| Total monitored hosts | Enabled monitored hosts visible to the API user in configured group IDs, deduplicated by host.get. Exclude the summary host. |
| Available / unavailable / unknown | Available if any active-agent/interface state is 1; unavailable if none is 1 and any is 2; unknown otherwise. These partition the total, not a universal application-health SLA. |
| Active / critical / high problems | problem.get countOutput, recent:false, source 0/object 0, same monitored host IDs; critical maps to Zabbix Disaster (5), High is exactly 4. Includes suppressed incidents unless policy explicitly changes. |
| Collector freshness | Epoch timestamp written after successful API queries; nodata 5-minute trigger in the template. Missing/stale data never implies zero incidents. |
| Top consumers | Last non-null metric per series, reduce to rows, sort descending and limit to 10. CPU/RAM per host, disk per filesystem, network per interface. |
| Operational Problems | Supported plugin Problems panel with host, host group, severity, status and acknowledgment columns; all current severities. |
Install the NOC summary collector and template
- In Zabbix Data collection > Templates > Import, import zabbix-noc-template.json. Create host group NOC collectors and technical host noc-production, visible name Production NOC summary; link Enterprise NOC summary.
- Set the host macro {$NOC.SENDER.IP} to the real collector source IP; configure incoming encryption PSK, unique identity noc-production and a generated PSK stored in a protected file. Trapper allowed_hosts and the server firewall must both permit that source only.
- Create a separate read-only API token for the collector covering the monitored environment groups; it needs host.get and problem.get. Use hostgroup.get to discover IDs. Create Production/Linux servers and Production/Windows servers group names, or change the dashboard group regex to your convention.
- Copy the protected token and PSK to /etc/grafana/secrets/noc-token and noc.psk with root:noc-collector 0640 permissions. Fill noc.env with actual group IDs, API URL, server address and technical host name. Never put secrets in the supplied public template.
sudo apt-get install -y zabbix-sender
sudo useradd --system --no-create-home --shell /usr/sbin/nologin noc-collector
sudo install -d -o root -g noc-collector -m 0750 /usr/local/lib/grafana-noc
sudo install -m 0755 noc-collector.py /usr/local/lib/grafana-noc/noc-collector.py
sudo install -o root -g noc-collector -m 0640 noc-collector.env.example /etc/grafana/noc.env
sudoedit /etc/grafana/noc.env
sudo install -m 0644 noc-collector.service noc-collector.timer /etc/systemd/system/
sudo systemctl daemon-reload
sudo systemctl start noc-collector.service
sudo journalctl -u noc-collector.service -n 30 --no-pager
sudo systemctl enable --now noc-collector.timer
Use a zabbix_sender build supporting TLS PSK, preferably the maintained Zabbix 7.0 package if the official repository is already configured. Successful collection prints Submitted 8 NOC metrics; verify all eight latest values in Zabbix. API failure or an empty permitted host scope fails the collector rather than publishing misleading zeros. Sender rejection also fails the service. Monitor that failure and the template’s nodata trigger through Zabbix actions outside Grafana.
Import enterprise-noc-dashboard.json. Counts follow the Environment selector and its summary host; they remain counts for the collector’s configured scope when you narrow the performance Group/Host selectors. Display that scope prominently and reconcile counts against Zabbix. For Staging create a separate noc-staging host with visible name Staging NOC summary and a separately configured collector. Do not select an environment that has no collector. Ensure known manual/suppressed incidents and a canary unavailable host match the documented counting rules.
Put overview stats at the top, Top 10 CPU/RAM/filesystem/interface panels in the middle and current Problems at the bottom. Show the last-success timestamp beside host counts, retain No data text and never replace unavailable data with zeros. Make problem acknowledgment a Zabbix-controlled workflow: the read-only Grafana integration cannot acknowledge incidents. API/interface availability describes monitoring transport; add application-specific health metrics for service SLOs.
Zabbix host.get monitored-host scope
Zabbix problem.get counting semantics
The supplied last-success Stat uses the official scale(1000) query function: Zabbix unixtime values are epoch seconds, while Grafana date units require milliseconds. Keep the conversion when editing the panel and verify its date against the collector log.
10. Dashboard variables and dynamic host selection
Open Dashboard settings > Variables > Add variable. Use Query variables with data source Zabbix and the structured query editor shown below. Refresh on dashboard load is enough for most inventory selectors. Set dependent variables after their parents. The current plugin supports legacy brace syntax but automatically converts it; new dashboards use the official structured query fields. Zabbix 7.0 removed Applications: use Item tag for relevant item grouping.
| Variable | Official query / filter |
|---|---|
| group | Query Type Group; Group /Linux servers|Windows servers/ (NOC: /^$environment\/.*/) |
| host | Query Type Host; Group $group; Host /.*/ |
| item_group | Query Type Item tag; Group $group; Host $host; Item Tag /component:.*/ |
| interface | Query Type Item; Group $group; Host $host; Item /Interface .*: Bits received/; returned full item names |
| environment | Custom: Production,Staging; group-name convention scopes NOC queries. Not a native inferred environment field. |
{"queryType":"group","group":"/Linux servers|Windows servers/"}
{"queryType":"host","group":"$group","host":"/.*/"}
{"queryType":"itemTag","group":"$group","host":"$host","itemTag":"/component:.*/"}
{"queryType":"item","group":"$group","host":"$host","item":"/Interface .*: Bits received/"}
In Metrics queries set Group $group, Host $host and Item tag $item_group. Enable Multi-value and Include All where useful and use /.*/ as the All value; the plugin handles variable substitution. The downloadable interface selector stores the full received-item name, avoiding brittle regex extraction of Windows GUIDs; use Item $interface in the dedicated inbound traffic panel. The all-interface panel uses /Interface .*: Bits (received|sent)/. Do not apply rate twice to template items already converted to bits/sec.
CPU utilization and Memory utilization have common names on Linux and Windows, so changing group/host dynamically updates those panels. OS-specific load and service panels remain in their separate dashboards; Uptime versus System uptime needs /^(System uptime|Uptime)$/ on a mixed-OS dashboard. Tags such as component:cpu can intentionally remove unrelated metrics: restore All if a panel shows No data. Variables improve navigation but cannot hide data from an authorized data-source user.
11. Alerts, events and duplicate-notification control
Zabbix triggers evaluate monitored items, create PROBLEM/recovery events and dispatch actions through media types. Grafana’s Problems panel reads those events; displaying a red panel does not send a notification. Grafana Alerting evaluates its own server-side rules and routes notifications through contact points and notification policies. Choose one paging owner for each incident: normally Zabbix for OS/template triggers, Grafana for a deliberately separate cross-source rule.
- Problems panel: Query type Problems, Show Problems, severity filters and acknowledgment columns. Acknowledged does not mean resolved; use event status. Set Use time range off for ongoing incidents that began before the selected range.
- Problem annotations: Dashboard settings > Annotations > Add annotation query > Zabbix; Group $group, Host $host, Min severity Warning, Show OK events and Show hostname enabled. Leave legacy Application blank on Zabbix 7.0. Correlate CPU spikes with problem/recovery markers.
- Grafana rule: Alerting > Alert rules > New alert rule. Select a fixed approved Linux host and CPU utilization numeric Metrics query A over 10m; Reduce B = Mean(A), Threshold C = B > 90; set pending period 5m and evaluation interval 1m. Preview before saving.
- Only Metrics and Item ID are supported by plugin alerting. Problems, Triggers, Services, Text and User macros queries are not supported for alert rules; plugin-side processing functions are limited. Use Grafana expressions for reductions and no dashboard variables in server-side alerts.
- Set no-data/error handling deliberately; route query failures to the monitoring owner rather than treating them as OK. Add labels owner, environment, service and source=grafana; include a runbook URL and impact text.
Email, Telegram and notification policies
For email configure [smtp] with the approved relay host, from_address, certificate trust and required STARTTLS policy. Store SMTP password using an approved environment/file provider; do not add it to dashboard JSON. Under Alerting > Contact points (or Notification configuration > Contact points in the updated navigation), create an Email contact point and send a test to the approved staging recipient. Under Notification policies route labels such as environment=Production to the right team, with grouping and repeat intervals.
[smtp]
enabled = true
host = smtp.example.com:587
user = grafana-notifications
password = $__file{/etc/grafana/secrets/smtp-password}
from_address = grafana@example.com
from_name = Enterprise Monitoring
startTLS_policy = MandatoryStartTLS
skip_verify = false
Grafana OSS supports a Telegram contact point for Grafana Alertmanager. Create an approved bot with BotFather, add it to the intended chat, obtain the chat ID, and enter bot token only in the secure contact-point field. Use the built-in Test function and then attach the contact point to a rule or policy. Restrict outbound access as required and never paste the bot token into a URL in article commands. Zabbix Telegram media types are a separate notification path.
To prevent duplicate paging, do not reproduce an existing Zabbix CPU trigger with the same Grafana recipient. Document rule ownership, use source/service labels for grouping, and coordinate maintenance silences in both systems when both legitimately own different rules. Test one PROBLEM, one recovery and a data-source failure in staging; confirm exactly the intended notifications and on-call escalation. Keep monitoring failure alerts outside the monitored Grafana instance.
Official Zabbix plugin alerting limitations
12. Performance optimization and optional Direct DB
Use Zabbix history for recent fine-grained metrics and trends for hourly aggregates over longer ranges. Grafana does not generate missing trends: numeric items and Zabbix retention must actually provide them. Match Trends After to real history retention, and Range to the dashboard range at which hourly aggregates are acceptable. A 30-day dashboard should not repeatedly fetch millions of one-minute points.
- Start at 1m dashboard refresh, 6h default range and 30s minimum refresh. Set panel minimum intervals near the item collection interval; widening a range should increase the query interval.
- Cache TTL caches item/host metadata, not a guarantee that live metric values are fresh. After enrollment or permission changes allow cache expiry or refresh/restart deliberately.
- Avoid All hosts × All items on every panel. Limit groups, use exact names or bounded regex and split dashboards by team/environment. A Top 10 transformation still retrieves its input series: it does not reduce API workload at the source.
- Use Query inspector, browser timing and Grafana journal to distinguish API latency, data volume, transforms and rendering. Query timeout is a guardrail, not a cure. Monitor Zabbix API/PHP workers and PostgreSQL slow queries separately.
- Leave historical item-value lookup and Host IP options off in Problems queries unless needed. Page large event lists, narrow filters and benchmark concurrency with representative NOC wallboards.
Optional PostgreSQL read-only access
Direct DB is optional and only accelerates history/trend reads. The API is still required for metadata, permissions and Problems. On the existing Zabbix PostgreSQL database create the dedicated role below; do not grant SELECT on every table or use the database owner. A password is set interactively with psql, never embedded in SQL. Enable TLS and a narrow hostssl pg_hba.conf rule plus a source-restricted firewall rule.
-- Execute in the Zabbix PostgreSQL database as an administrator.
-- Set a unique password interactively with psql: \password grafana_zabbix_ro
CREATE ROLE grafana_zabbix_ro LOGIN;
GRANT CONNECT ON DATABASE zabbix TO grafana_zabbix_ro;
GRANT USAGE ON SCHEMA public TO grafana_zabbix_ro;
GRANT SELECT ON public.history, public.history_uint, public.trends, public.trends_uint TO grafana_zabbix_ro;
ALTER ROLE grafana_zabbix_ro SET default_transaction_read_only = on;
ALTER ROLE grafana_zabbix_ro SET statement_timeout = '60s';
-- Narrow pg_hba.conf entry (trusted server cert required):
-- hostssl zabbix grafana_zabbix_ro 192.0.2.20/32 scram-sha-256
In Grafana add a PostgreSQL data source for the Zabbix database with that user, TLS verify-full, the trusted CA and hostname. Save & test it, then select it under the Zabbix data source’s Additional settings > Direct DB Connection. Prefer dbConnectionDatasourceUID for provisioning. Keep these settings absent/disabled in the basic YAML. Restrict access: SQL reads can bypass API host-level permissions and expose all numeric history in the granted tables. Use only for trusted, isolated operators; this edition caveat can make API-only the right choice.
13. Grafana backup and practical recovery
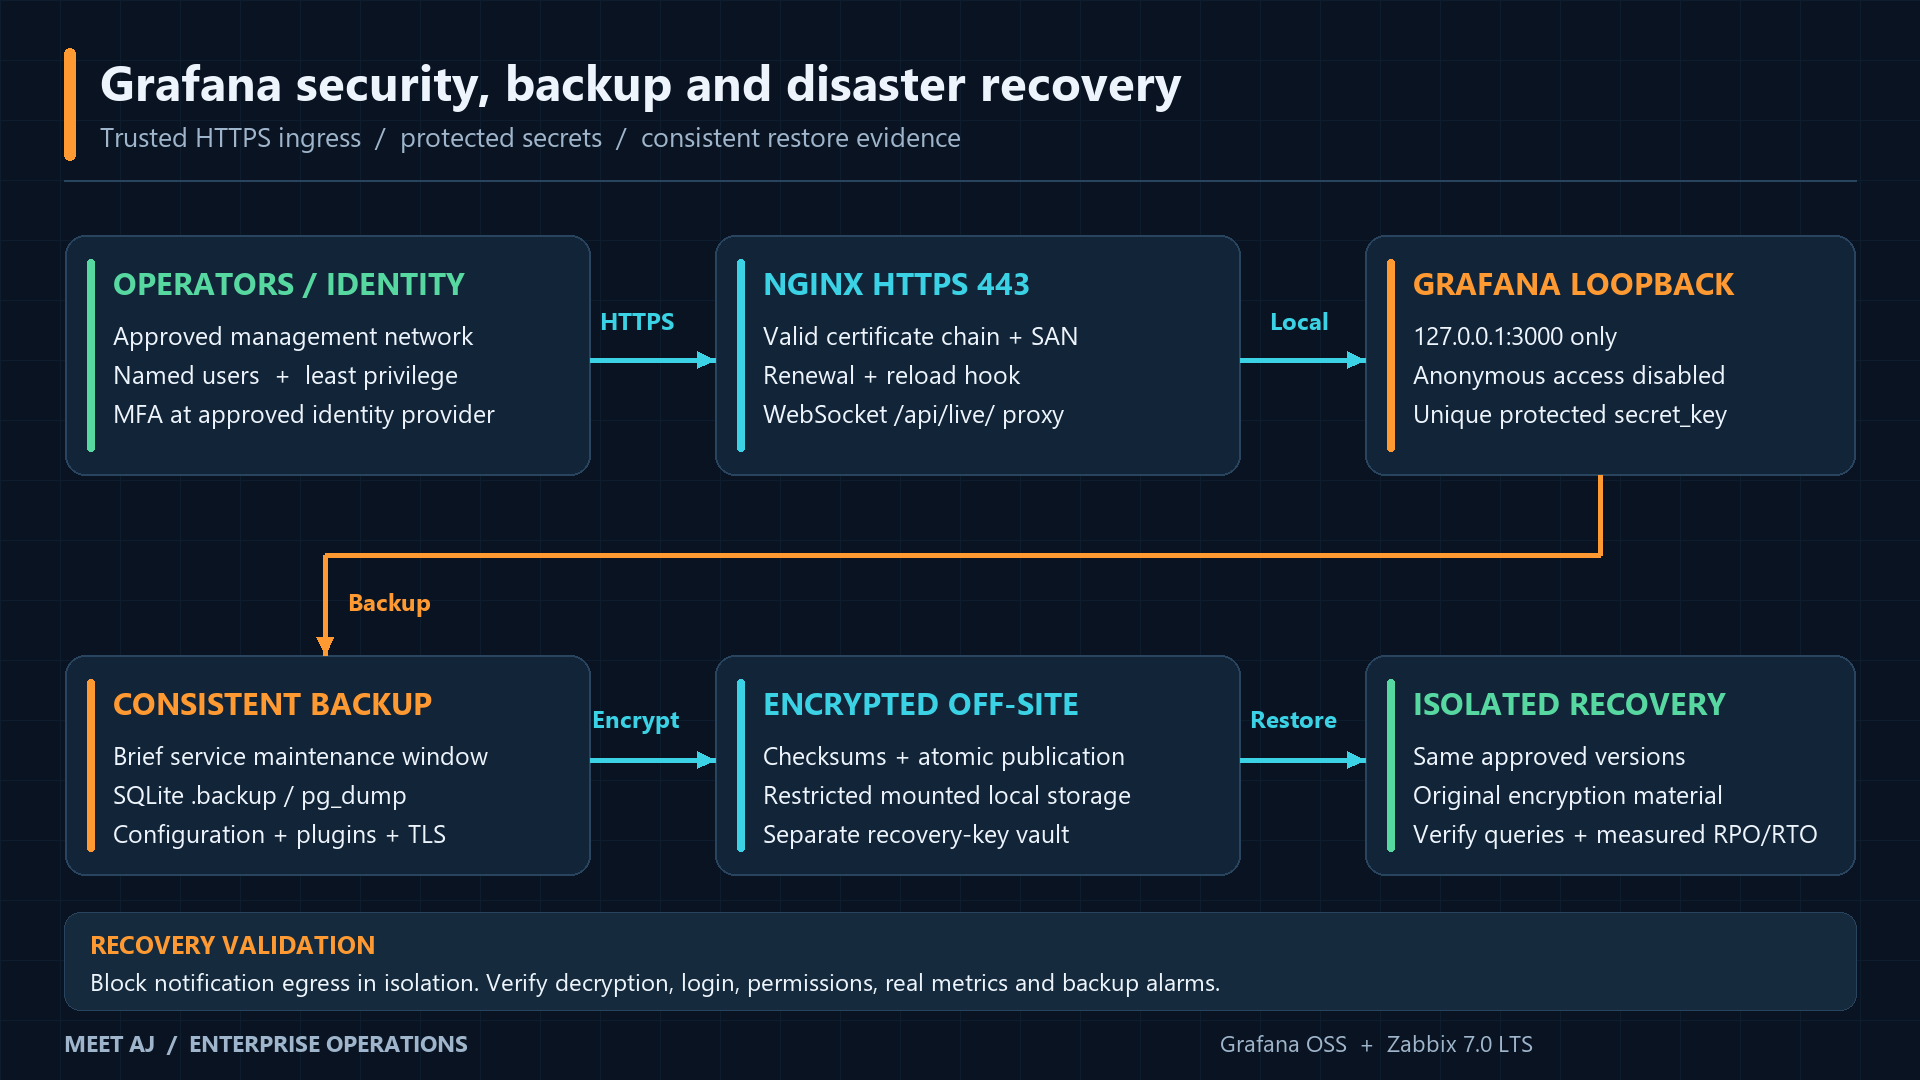
Back up Grafana metadata separately from the Zabbix monitoring database. Protect /etc/grafana/grafana.ini, provisioning files, root-only environment files, the encryption secret, systemd overrides, plugin files and version inventory, file-provisioned dashboards, Nginx configuration and TLS certificate/private-key state. UI dashboard exports are useful portable artifacts, but do not contain usable data-source secrets or all organization settings. Export dashboard JSON via the dashboard sharing/export menu or provision reviewed JSON from version control.
SQLite and PostgreSQL consistency
Copying a live SQLite grafana.db alone can miss journal/WAL state. The supplied backup briefly stops Grafana, creates a SQLite .backup snapshot, checks PRAGMA integrity_check, archives configuration/plugins, and restarts Grafana even on failure. Schedule this maintenance window and silence only planned service-availability checks. It assumes the downloaded sqlite3/path settings and a healthy local service; customize deliberately if using a different path or multi-instance architecture.
For a separate Grafana PostgreSQL metadata database set GRAFANA_DB_TYPE=postgres and PG* values for that database, not Zabbix. pg_dump custom format gives a transaction-consistent logical snapshot; pg_restore decoding checks archive readability, not application recovery. Supply a restricted backup role able to read the Grafana schema and a protected PGPASSFILE; do not print its contents. This script still stops Grafana to align configuration/plugin files with the metadata snapshot. Database administrator-managed roles and TLS settings require their own recovery plan.
#!/usr/bin/env bash
set -Eeuo pipefail
umask 077
[[ $EUID -eq 0 ]] || { echo 'Run as root' >&2; exit 1; }
: "${BACKUP_ROOT:=/srv/grafana-backups}"
: "${GRAFANA_DB_TYPE:=sqlite3}"
[[ $BACKUP_ROOT == /srv/grafana-backups ]] || { echo 'Review script before changing backup root' >&2; exit 1; }
mountpoint -q "$BACKUP_ROOT" || { echo 'Backup volume is not mounted' >&2; exit 1; }
install -d -m 0700 /run/grafana-backup
exec 9>/run/grafana-backup/lock
flock -n 9 || { echo 'Backup already running' >&2; exit 1; }
stamp=$(date -u +%Y%m%dT%H%M%SZ)
work=$(mktemp -d "$BACKUP_ROOT/.partial.XXXXXX")
stopped=0
cleanup() {
    rc=$?
    trap - EXIT
    if ((stopped)); then
        if ! systemctl start grafana-server; then echo 'CRITICAL: Grafana restart failed' >&2; rc=1; fi
    fi
    if ((rc)); then echo "FAILED; incomplete backup retained at $work" >&2; fi
    exit "$rc"
}
trap cleanup EXIT
systemctl is-active --quiet grafana-server || { echo 'Grafana must be healthy before backup' >&2; exit 1; }
needed=$(du -sk /etc/grafana /var/lib/grafana | awk '{sum+=$1} END {print sum*2+1048576}')
available=$(df -Pk "$BACKUP_ROOT" | awk 'NR==2 {print $4}')
((available > needed)) || { echo 'Insufficient backup capacity' >&2; exit 1; }
# Short maintenance window keeps database, provisioning and plugin files aligned.
stopped=1
systemctl stop grafana-server
if [[ $GRAFANA_DB_TYPE == sqlite3 ]]; then
    sqlite3 /var/lib/grafana/grafana.db ".backup '$work/grafana.db'"
    [[ $(sqlite3 "$work/grafana.db" 'PRAGMA integrity_check;') == ok ]]
elif [[ $GRAFANA_DB_TYPE == postgres ]]; then
    pg_dump --format=custom --no-owner --no-acl --file="$work/grafana.pgdump"
    pg_restore --file=/dev/null "$work/grafana.pgdump"
else
    echo 'Supported database types: sqlite3 or postgres' >&2; exit 1
fi
dpkg-query -W -f='${Package} ${Version}\n' grafana > "$work/grafana-version.txt"
find /var/lib/grafana/plugins -name plugin.json -exec python3 -c \
    'import json,sys; p=json.load(open(sys.argv[1])); print(p["id"],p.get("info",{}).get("version","unknown"))' {} \; > "$work/plugin-inventory.txt"
paths=(etc/grafana var/lib/grafana/plugins)
for path in etc/default/grafana-server etc/systemd/system/grafana-server.service.d var/lib/grafana/dashboards etc/nginx etc/letsencrypt; do
    [[ ! -e /$path ]] || paths+=("$path")
done
# This archive contains credentials, secret keys and TLS private keys: root-only.
tar -C / -czf "$work/config-and-plugins.tar.gz" "${paths[@]}"
tar -tzf "$work/config-and-plugins.tar.gz" > /dev/null
systemctl start grafana-server
stopped=0
systemctl is-active --quiet grafana-server
(cd "$work"; sha256sum ./* > SHA256SUMS; sha256sum -c SHA256SUMS)
final="$BACKUP_ROOT/$stamp"
[[ ! -e $final ]] || { echo 'Backup timestamp collision' >&2; exit 1; }
mv -- "$work" "$final"
work=$final
if [[ -n ${RESTIC_REPOSITORY:-} ]]; then
    : "${RESTIC_PASSWORD_FILE:?Configure protected restic password file}"
    restic backup --tag grafana "$final"
fi
echo "Backup complete: $final"
# Retention intentionally separate: expire only after confirmed off-site recovery tests.sudo install -m 0750 -o root -g root grafana-backup.sh /usr/local/sbin/grafana-backup.sh
sudo install -m 0600 -o root -g root grafana-backup.env.example /etc/grafana/backup.env
sudoedit /etc/grafana/backup.env
# Mount an approved backup volume at /srv/grafana-backups first.
findmnt /srv/grafana-backups
sudo install -m 0644 grafana-backup.service grafana-backup.timer /etc/systemd/system/
sudo systemctl daemon-reload
sudo systemctl start grafana-backup.service
sudo journalctl -u grafana-backup.service -n 100 --no-pager
sudo systemctl enable --now grafana-backup.timer
sudo systemctl list-timers grafana-backup.timer[Unit]
Description=Consistent Grafana metadata and configuration backup
After=network-online.target grafana-server.service
Wants=network-online.target
[Service]
Type=oneshot
User=root
EnvironmentFile=/etc/grafana/backup.env
ExecStart=/usr/local/sbin/grafana-backup.sh
UMask=0077
TimeoutStartSec=20min
PrivateTmp=true
ProtectHome=true[Unit]
Description=Daily Grafana backup
[Timer]
OnCalendar=*-*-* 02:15:00 UTC
RandomizedDelaySec=15min
Persistent=true
Unit=grafana-backup.service
[Install]
WantedBy=timers.targetThe timer uses 02:15 UTC plus up to 15 minutes of jitter, independent of host timezone, and catches a missed run after boot. The script refuses an unmounted backup volume, obtains a lock, checks capacity, uses restrictive permissions, writes a hidden partial directory, verifies checksums and publishes atomically. Failure exits nonzero and preserves evidence; alert on failed backup units and aging backups through Zabbix or an external scheduler. Retention is intentionally separate from creation: expire backups only after verified encrypted off-site copies and periodic restore drills.
The backup archive contains API tokens, session/encryption configuration and TLS private keys. Store it on encrypted storage with root-only access. Initialize a restic repository separately, store its password in a protected file, and optionally enable RESTIC_REPOSITORY/RESTIC_PASSWORD_FILE for encrypted off-site upload. Keep recovery keys in a separately accessible vault; test retrieval from the recovery site. A successful backup process or checksum is not proof that Grafana can decrypt credentials after restore.
Restore to an isolated recovery host
- Prepare Ubuntu 24.04 with the exact recorded Grafana release and signed plugin versions. Block notification egress and automatic collectors/backup timers. Restore original host/domain configuration only inside an isolated network until accepted.
- Recover a complete dated backup and verify SHA256SUMS before extracting. Stop Grafana; archive the recovery host’s current configuration separately. Review the tar listing and extract only a trusted backup to the intended host.
- Restore /etc/grafana including the original secret_key and environment files, plugin files, file dashboards, systemd override and Nginx/certificate state. If external KMS/encryption providers were configured, recover their key access too. Losing the original encryption material requires re-entering data-source secrets.
- For SQLite restore the consistent grafana.db and remove any stale target WAL/SHM only while Grafana is stopped and after preserving the target state. For PostgreSQL restore into an empty Grafana database with a compatible pg_restore and the intended role. Never overwrite the Zabbix database.
- Restore file ownership, validate configuration, reload systemd and start Grafana. Verify login, organization/folder permissions, plugin inventory, Save & test, real Linux/Windows queries, NOC counts/freshness and dashboard variables. Validate certificates and renewal separately.
- Measure RPO from the backup timestamp and RTO to accepted monitoring; compare to business targets. Test one approved notification after unblocking only staging transport, record evidence, then cut over DNS and restore production policies through change control.
# On the isolated recovery host; BACKUP_DIR is a trusted verified dated directory.
BACKUP_DIR=/srv/grafana-backups/20261009T021500Z
cd "$BACKUP_DIR"
sudo sha256sum -c SHA256SUMS
sudo systemctl stop grafana-server
sudo tar -tzf config-and-plugins.tar.gz
sudo tar -C / -xzf config-and-plugins.tar.gz
# SQLite path only:
sudo install -o grafana -g grafana -m 0640 grafana.db /var/lib/grafana/grafana.db
sudo rm -f -- /var/lib/grafana/grafana.db-wal /var/lib/grafana/grafana.db-shm
sudo -u grafana sqlite3 /var/lib/grafana/grafana.db 'PRAGMA integrity_check;'
sudo systemctl daemon-reload
sudo nginx -t
sudo systemctl start grafana-server
sudo systemctl status grafana-server --no-pager
curl --fail --silent --show-error --header "Host: grafana.example.com" http://127.0.0.1:3000/api/health
For PostgreSQL use the alternative below on an empty recovery database after its role has been created. Substitute actual protected connection settings and matching source/target versions. pg_restore returns zero when the dump loads; acceptance still requires the UI/API and decryption checks described above. Never run both SQLite and PostgreSQL restore branches.
sudo -u postgres createdb -O grafana grafana_recovery
sudo install -o postgres -g postgres -m 0600 /srv/grafana-backups/20261009T021500Z/grafana.pgdump /var/lib/postgresql/grafana-recovery.pgdump
sudo -u postgres pg_restore --exit-on-error --no-owner --no-acl --role=grafana --dbname=grafana_recovery /var/lib/postgresql/grafana-recovery.pgdump
sudo rm -f -- /var/lib/postgresql/grafana-recovery.pgdump
# Point recovered Grafana [database] at this recovery DB before starting.
Official Grafana backup scope and SQLite shutdown guidance
SQLite online backup API and consistency
14. Operational troubleshooting
For every failure follow Symptoms → Root Cause → Diagnostic Commands → Expected Output → Resolution. Commands are diagnostics and never contain a literal API token. A health check on apiinfo.version or /api/health proves only that stage; verify a real authorized item query before declaring integration healthy. Inspect logs locally and redact secrets before sharing evidence.
1. Grafana service fails to start
Symptoms: Service is failed or repeatedly restarting.
Root Cause: Invalid INI, unreadable encryption-secret file, metadata database permissions or a port conflict.
Diagnostic Commands: run locally; inspect the relevant UI query filters as well.
sudo systemctl status grafana-server --no-pager
sudo journalctl -u grafana-server -n 100 --no-pager
sudo ss -lntp | grep ":3000"
sudo -u grafana test -r /etc/grafana/secrets/secret_key
Expected Output: active (running), no startup error, one loopback listener and a successful readability test.
Resolution: Correct the specific logged setting/path/ownership, preserve the existing secret, then restart and recheck /api/health.
2. Grafana Web UI is inaccessible
Symptoms: Browser times out, 502 or redirects to the wrong domain.
Root Cause: DNS/firewall mismatch, Nginx not listening, wrong root_url, or upstream service down.
Diagnostic Commands: run locally; inspect the relevant UI query filters as well.
getent ahosts grafana.example.com
sudo ufw status verbose
sudo nginx -t
curl --fail --header "Host: grafana.example.com" http://127.0.0.1:3000/api/health
curl --head https://grafana.example.com/login
Expected Output: DNS resolves intended host; nginx -t succeeds; local health 200 and HTTPS login 200 or an expected login redirect.
Resolution: Fix routing/DNS/allowlist, start the backend and align domain/root_url. Keep port 3000 loopback-only.
3. Zabbix plugin does not appear
Symptoms: No Zabbix connection option after installation.
Root Cause: Wrong plugin directory, missing restart, app not enabled or signature rejection.
Diagnostic Commands: run locally; inspect the relevant UI query filters as well.
sudo grafana cli --pluginsDir /var/lib/grafana/plugins plugins ls
sudo journalctl -u grafana-server -n 100 --no-pager
sudo test -f /var/lib/grafana/plugins/alexanderzobnin-zabbix-app/plugin.json
Expected Output: Installed app is listed, manifest exists and journal has no signature/dependency rejection.
Resolution: Install into the configured directory, restart, then Administration > Plugins and data > Plugins > Zabbix > Enable.
4. Zabbix API authentication fails
Symptoms: Not authorized, invalid token or expired session on Save & test.
Root Cause: Expired token, disabled owner, role API access denial, missing environment or a proxy stripping Authorization.
Diagnostic Commands: run locally; inspect the relevant UI query filters as well.
sudo ZABBIX_API_URL=https://zabbix.example.com/api_jsonrpc.php ZABBIX_TOKEN_FILE=/etc/grafana/secrets/zabbix-token python3 zabbix-api-probe.py
sudo journalctl -u grafana-server -n 50 --no-pager
Expected Output: API version 7.0.x and a nonzero authorized Visible hosts count.
Resolution: Regenerate an expiring token for the correct enabled owner, verify role/permissions and forwarded header, update only the protected environment and restart provisioning.
5. Zabbix data source returns an error
Symptoms: Save & test reports JSON parse, method denied, 404 or 502.
Root Cause: Wrong frontend path, HTML login interception, inaccessible API or denied API method.
Diagnostic Commands: run locally; inspect the relevant UI query filters as well.
curl --fail --silent --show-error -H "Content-Type: application/json-rpc" --data '{"jsonrpc":"2.0","method":"apiinfo.version","params":{},"id":1}' https://zabbix.example.com/api_jsonrpc.php
sudo journalctl -u grafana-server -n 50 --no-pager
Expected Output: JSON result with version, not HTML or a redirect; plugin query inspector shows a valid response.
Resolution: Verify root or /zabbix path, remove inappropriate API login interception and allow required read methods. Retest a permitted item.
6. Dashboard shows No data
Symptoms: Empty graph despite a successful API test.
Root Cause: Wrong item names, uncreated discovery items, disabled/unsupported items, stale data, tag filters or a range outside history.
Diagnostic Commands: run locally; inspect the relevant UI query filters as well.
date -u
timedatectl status
sudo journalctl -u grafana-server -n 50 --no-pager
Expected Output: Clocks synchronized; Latest data has a recent supported sample; Query inspector filters match the exact discovered item.
Resolution: Reset item_group/interface selectors, use the real item name, wait for discovery/collection and narrow to a recent range; enable trends only when available.
7. Host groups are missing
Symptoms: Picker omits groups present for an administrator in Zabbix.
Root Cause: Integration owner lacks group Read permission, role restriction or cached metadata.
Diagnostic Commands: run locally; inspect the relevant UI query filters as well.
sudo ZABBIX_API_URL=https://zabbix.example.com/api_jsonrpc.php ZABBIX_TOKEN_FILE=/etc/grafana/secrets/zabbix-token python3 zabbix-api-probe.pyExpected Output: Visible-host scope matches the integration user, not the Zabbix super-admin inventory.
Resolution: Grant only the approved groups under Host permissions, ensure hostgroup.get/host.get allowed, refresh the variable and allow cache TTL expiry.
8. Zabbix API connection times out
Symptoms: Queries exceed 30s or intermittent gateway timeouts.
Root Cause: Blocked routing/firewall, overloaded PHP/API/database or an unbounded dashboard query.
Diagnostic Commands: run locally; inspect the relevant UI query filters as well.
getent ahosts zabbix.example.com
curl --head --connect-timeout 5 --max-time 30 https://zabbix.example.com/
sudo journalctl -u grafana-server -n 50 --no-pager
Expected Output: DNS resolves and HTTPS responds promptly; API query duration stays below configured timeout.
Resolution: Fix network access first, narrow host/item scope and ranges, check Zabbix worker/database load, then tune timeouts based on measurements.
9. HTTPS certificate verification fails
Symptoms: x509 unknown authority, hostname mismatch or certificate expired.
Root Cause: Incomplete certificate chain, untrusted internal CA, wrong SAN/domain or failed renewal.
Diagnostic Commands: run locally; inspect the relevant UI query filters as well.
openssl s_client -connect zabbix.example.com:443 -servername zabbix.example.com -verify_return_error </dev/null
timedatectl status
sudo certbot certificates
Expected Output: Verify return code: 0 (ok), matching SAN and valid dates; clock correct.
Resolution: Serve full chain, install approved CA trust on Grafana and renew valid certs. Do not use Skip TLS verify as production remediation.
10. Grafana dashboard is slow
Symptoms: Long spinner, excessive browser memory or API saturation.
Root Cause: High cardinality, broad history query, fast refresh, expensive transforms/problem lookups.
Diagnostic Commands: run locally; inspect the relevant UI query filters as well.
sudo journalctl -u grafana-server -n 100 --no-pager
sudo systemctl status grafana-server --no-pager
Expected Output: Query inspector isolates latency and result size; logs show no repeated timeouts.
Resolution: Reduce series/panels, use trends for wide ranges and 1m+ refresh, disable unused event enrichments, benchmark before considering read-only Direct DB.
11. Plugin version incompatibility
Symptoms: Plugin blocked by version requirement, stale Angular code or missing definition.
Root Cause: Grafana below minimum or mixed/stale plugin artifacts after an upgrade.
Diagnostic Commands: run locally; inspect the relevant UI query filters as well.
grafana --version
sudo grafana cli --pluginsDir /var/lib/grafana/plugins plugins ls
sudo journalctl -u grafana-server -n 100 --no-pager
Expected Output: Approved stable Grafana and signed React plugin; at review 13.2.3 / 6.9.1 and minimum 11.6.0.
Resolution: Stage a compatible version pair; preserve old artifact, replace only the stale plugin directory with an approved clean signed installation, restart and retest dashboards/alerts.
12. Problems panel displays no events
Symptoms: Panel is empty although Zabbix has active incidents.
Root Cause: Wrong query type, severity/acknowledgment/tag/host filters, Use time range hides older incidents or missing event read permissions.
Diagnostic Commands: run locally; inspect the relevant UI query filters as well.
sudo journalctl -u grafana-server -n 100 --no-pagerExpected Output: Query inspector uses Problems (5), current Show Problems, Use time range false and returns permitted active events.
Resolution: Use Zabbix Problems visualization, reset severity/ack/tag filters, allow problem.get/event.get/trigger.get reads, and compare as the integration owner. Zero current problems can be valid.
15. Production acceptance checklist
- [ ] Installation: stable Grafana/plugin versions recorded, APT key verified, systemd enabled, health and reboot checks completed.
- [ ] Security: valid HTTPS chain/SAN, renewal tested, loopback-only 3000, approved source firewall and IPv6 policy, no anonymous access/default password.
- [ ] Identity: named admins, least privilege roles, IdP MFA and removal tested, emergency access documented; OSS data-source visibility understood.
- [ ] Zabbix: verified API path and trusted TLS, scoped owner/token expiry, read permissions and real Save & test plus numeric item queries.
- [ ] Linux: CPU/load/RAM/available memory/filesystem/network/uptime/availability values compared with Latest data and unit conversions checked.
- [ ] Windows: actual discovered services/filesystems/interfaces, valid state mappings, active Event Log item and controlled new-event test completed.
- [ ] NOC: collector scope and permissions reviewed, total=available+unavailable+unknown, Disaster/High counts reconciled, freshness and collector-failure alarms tested.
- [ ] Reliability: variables and mixed-OS shared panels verified, current Problems includes old ongoing events, no-data/error behavior and separate monitoring of Grafana itself.
- [ ] Notifications: one incident owner, contact-point tests authorized, PROBLEM/recovery observed, no duplicate paging, escalation and maintenance policies documented.
- [ ] Performance: representative concurrent dashboards measured, bounded filters, refresh/query interval and history/trend retention matched.
- [ ] Backup: consistent metadata snapshot, complete configuration/secret/plugin/certificate inventory, checksum and encrypted off-site copy with external failure alarms.
- [ ] Recovery: isolated restore validates decryption, login, roles, actual data queries, measured RPO/RTO and separate vault key retrieval.
- [ ] Operations: owner/on-call, patch window, capacity targets, restore schedule, approved rollback and handover evidence recorded.
Acceptance requires an actual Zabbix API connection and representative live data. This article’s downloadable dashboard definitions contain no live metric results and do not claim a successful production integration. Operators must complete the checklist in staging and then their approved production environment.
Conclusion and operational handover
A useful enterprise monitoring stack combines reliable Zabbix collection and trigger evaluation with clear Grafana views, controlled access and recoverable configuration. Hand over the actual version inventory, scoped API ownership, dashboard/item mappings, alert ownership and measured restore evidence. Keep API-only integration as the default and add optional components only when their cost and authorization boundaries are understood.
Frequently asked questions
Does Grafana replace Zabbix agents or Server?
No. Zabbix collects, stores and evaluates monitoring data; Grafana queries the Zabbix API and visualizes it.
Is Direct DB required?
No. The official plugin connects through the API. Direct DB is optional for numeric history/trend performance and needs a separately secured read-only role.
Which stable versions were verified?
Grafana OSS 13.2.3 and Zabbix app 6.9.1 on 9 October 2026; the plugin requires Grafana 11.6.0 or later and documents Zabbix 7.0 authentication.
What is the correct Zabbix API URL?
Verify the frontend mount: /api_jsonrpc.php at the root or /zabbix/api_jsonrpc.php when that is the installed web path.
Can I use Application variables on Zabbix 7.0?
Use Item tag variables. Zabbix removed Applications in 5.4, and the current plugin exposes a structured item-tag query.
Does the NOC JSON invent total-host counts?
No. Included API collector code and a trapper template implement scoped host/problem counts and freshness; install them before using the overview panels.
Can the Problems query create Grafana alerts?
No. Plugin alerting supports numeric Metrics and Item ID queries; use Zabbix triggers/actions for Zabbix problem notifications.
Why must the encryption secret be backed up?
Stored data-source credentials need the original encryption material for recovery. Dashboard JSON alone cannot restore those credentials.
Official References, downloads and related articles
Official References are linked at the relevant chapters. The downloads are authored configuration templates and real dashboard structures, not claimed exports from a running Grafana instance. Replace documentation domains, IPs, group IDs, secret placeholders and certificate paths locally. Compare actual discovered item names before importing. Every download is also included in the configuration ZIP.
Download: HTTP certificate bootstrap
Download: Nginx HTTPS reverse proxy
Download: Grafana production configuration
Download: API-token data source provisioning
Download: App plugin provisioning
Download: Protected environment template
Download: Systemd environment override
Download: Dashboard file provisioning
Download: Linux dashboard JSON
Download: Windows dashboard JSON
Download: Enterprise NOC dashboard JSON
Download: Safe API connectivity probe
Download: NOC environment template
Download: NOC collector systemd service
Download: NOC Zabbix trapper template
Download: Optional PostgreSQL read-only grants
Download: Consistent backup script
Download: Backup environment template
Download: Backup systemd service
Download: Bilingual restore instructions
Download: Bilingual security checklist
Download: Package README and deployment order
Download the complete configuration package
Related: Zabbix Server, Linux/Windows agents and disaster recovery
Related: Oracle Database enterprise deployment
Related: Apache Tomcat systemd and security
Related: Redis production monitoring
Related: MongoDB enterprise operations